Compare Baseline Performance With and Without Shuffled Labels
Source:R/plot_ml.R
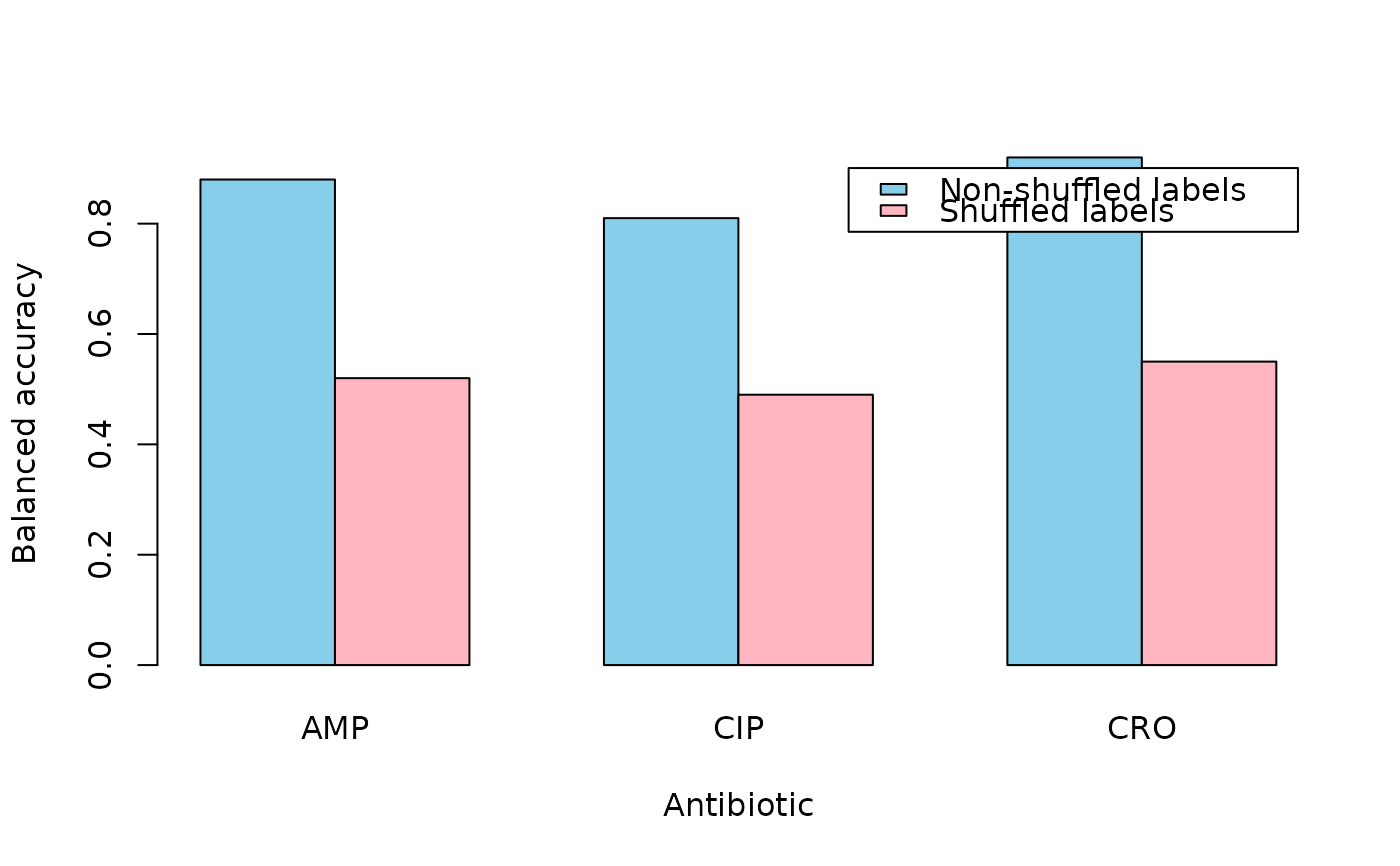
plotBaselineComparison.RdProduces a bar plot comparing balanced accuracy for each antibiotic using true AMR labels vs. randomly shuffled labels.
plotBaselineComparison(non_shuffled_label_results, shuffled_label_results)Arguments
- non_shuffled_label_results
A performance tibble with
antibioticandbal_acccolumns (one row per antibiotic), such as an aggregatedperformance_tibblefromrunMLPipeline(shuffle_labels = FALSE).- shuffled_label_results
The corresponding shuffled-label performance tibble, e.g. from
runMLPipeline(shuffle_labels = TRUE).
Value
A barplot comparing balanced accuracy across antibiotics.
Examples
non_shuffled <- tibble::tibble(
  antibiotic = c("AMP", "CIP", "CRO"),
  bal_acc    = c(0.88, 0.81, 0.92)
)
shuffled <- tibble::tibble(
  antibiotic = c("AMP", "CIP", "CRO"),
  bal_acc    = c(0.52, 0.49, 0.55)
)
plotBaselineComparison(non_shuffled, shuffled)

#>      [,1] [,2] [,3]
#> [1,]  1.5  4.5  7.5
#> [2,]  2.5  5.5  8.5
#> [,1] [,2] [,3]
#> [1,] 1.5 4.5 7.5
#> [2,] 2.5 5.5 8.5