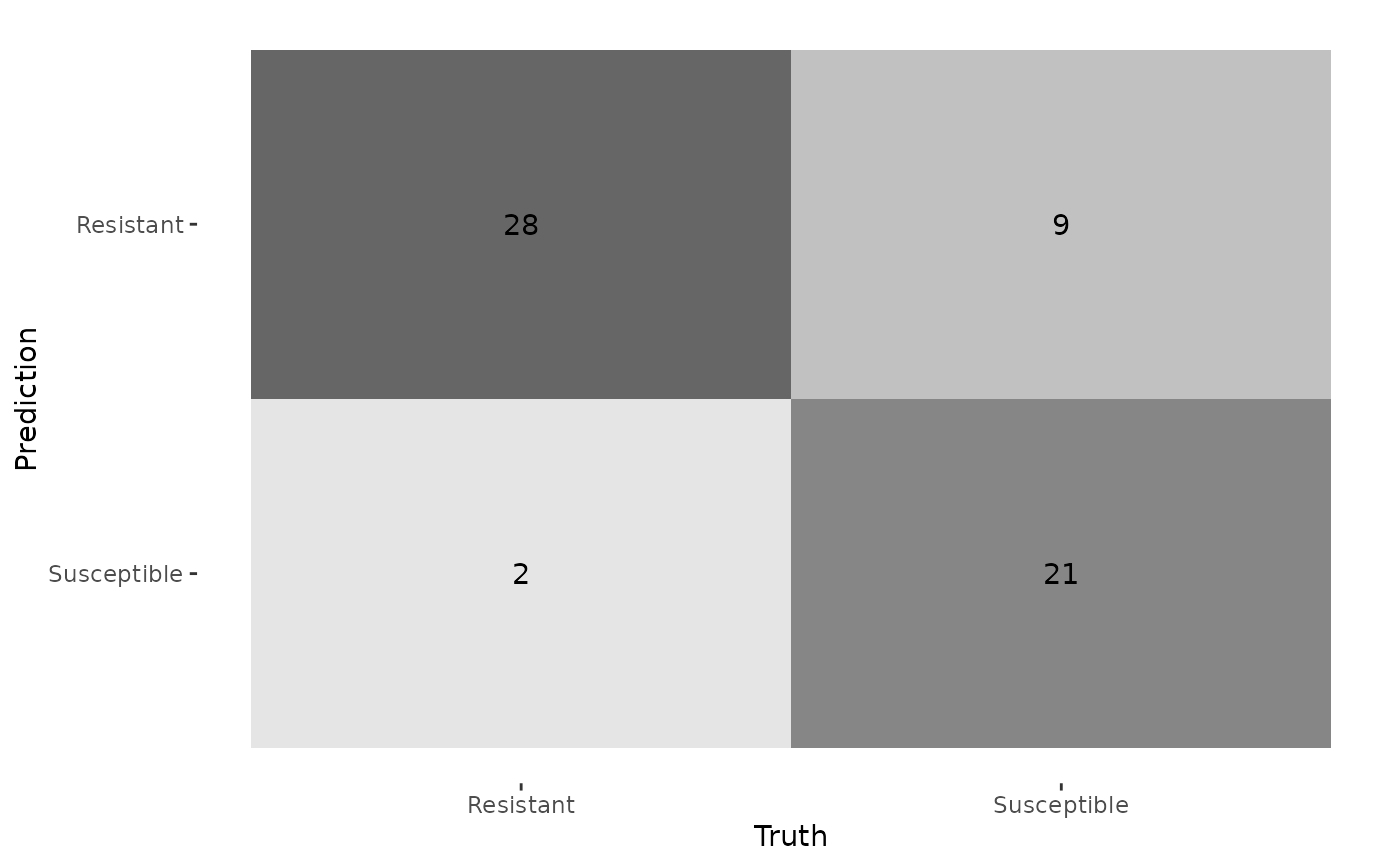
Produces a heatmap visualization of the confusion matrix for AMR predictions.
plotCM(test_data_plus_predictions)Arguments
- test_data_plus_predictions
A tibble containing true and predicted phenotype labels (e.g. the output of
predictML()), or a path to a TSV file containing the same.
Value
A heatmap (ggplot2 object) showing the confusion matrix.