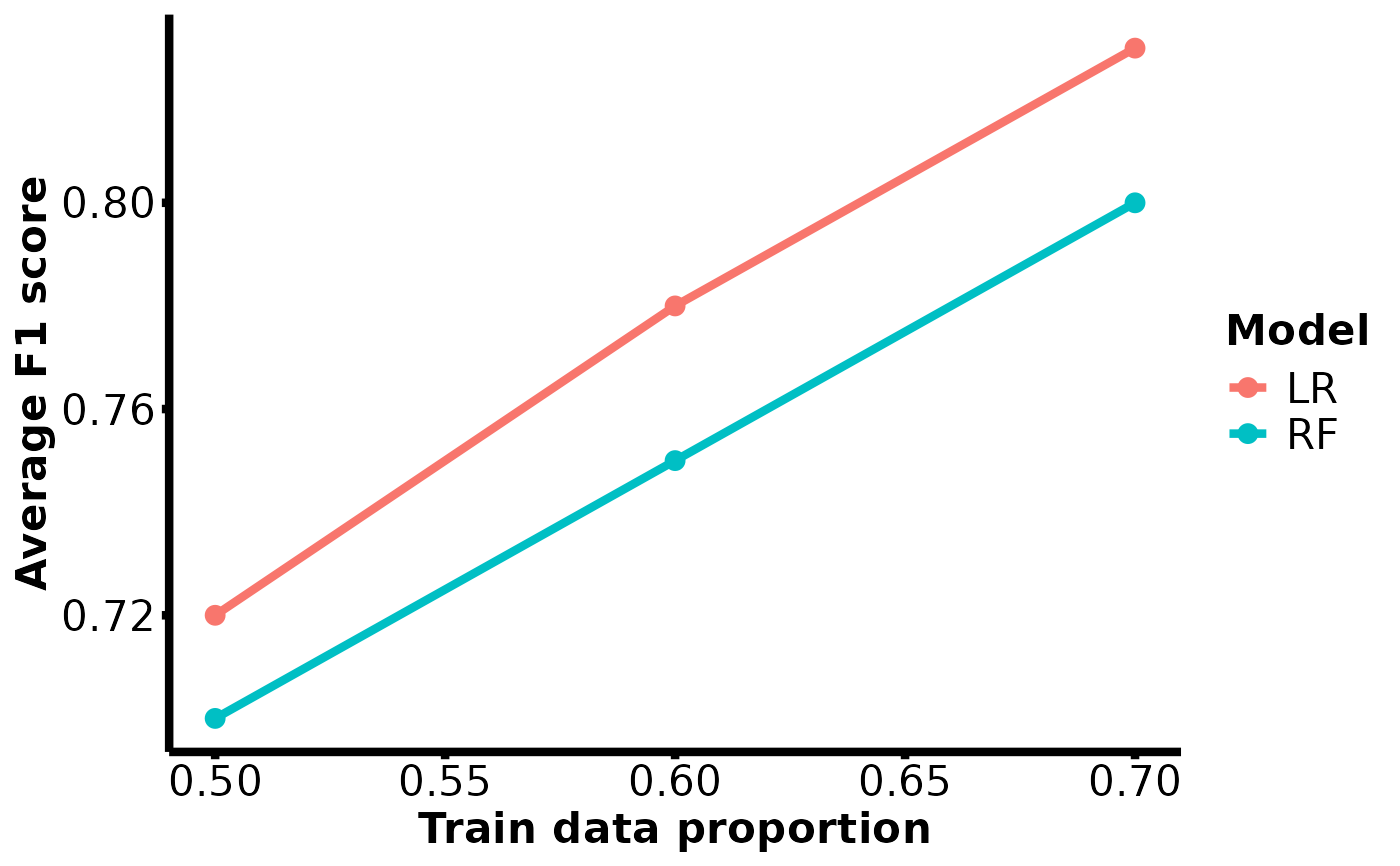
Plots performance metric or runtime vs. training data proportion or number of cross-validation folds, colored by model.
plotDefaultEval(
  default_eval_tibble,
  x_default_eval = "train_prop",
  y_default_eval = "avg_f1_score",
  xlab = "Train data proportion",
  ylab = "Average F1 score"
)
Arguments
- default_eval_tibble
Output of
findOptimalMLDefaults()- x_default_eval
chr x value of default evaluation plot: "train_prop" or "n_fold"
- y_default_eval
chr y value of default evaluation plot. It can be "avg_runtime_sec" or one of the following performance metrics: "avg_f1_score", "avg_log2_apop", "avg_bal_acc", or "avg_nmcc"
- xlab
chr Label for x axis
- ylab
chr Label for y axis
Value
A ggplot2 scatterplot (performance metric or runtime vs.
train_prop or n_fold), colored by model
Examples
default_eval <- tibble::tibble(
  train_prop      = c(0.5, 0.6, 0.7, 0.5, 0.6, 0.7),
  n_fold          = rep(5, 6),
  model           = rep(c("LR", "RF"), each = 3),
  avg_f1_score    = c(0.72, 0.78, 0.83, 0.70, 0.75, 0.80)
)
plotDefaultEval(default_eval,
  x_default_eval = "train_prop",
  y_default_eval = "avg_f1_score"
)
#> Warning: Using `size` aesthetic for lines was deprecated in ggplot2 3.4.0.
#> ℹ Please use `linewidth` instead.
#> ℹ The deprecated feature was likely used in the amRml package.
#>   Please report the issue at <https://github.com/JRaviLab/amRml/issues>.