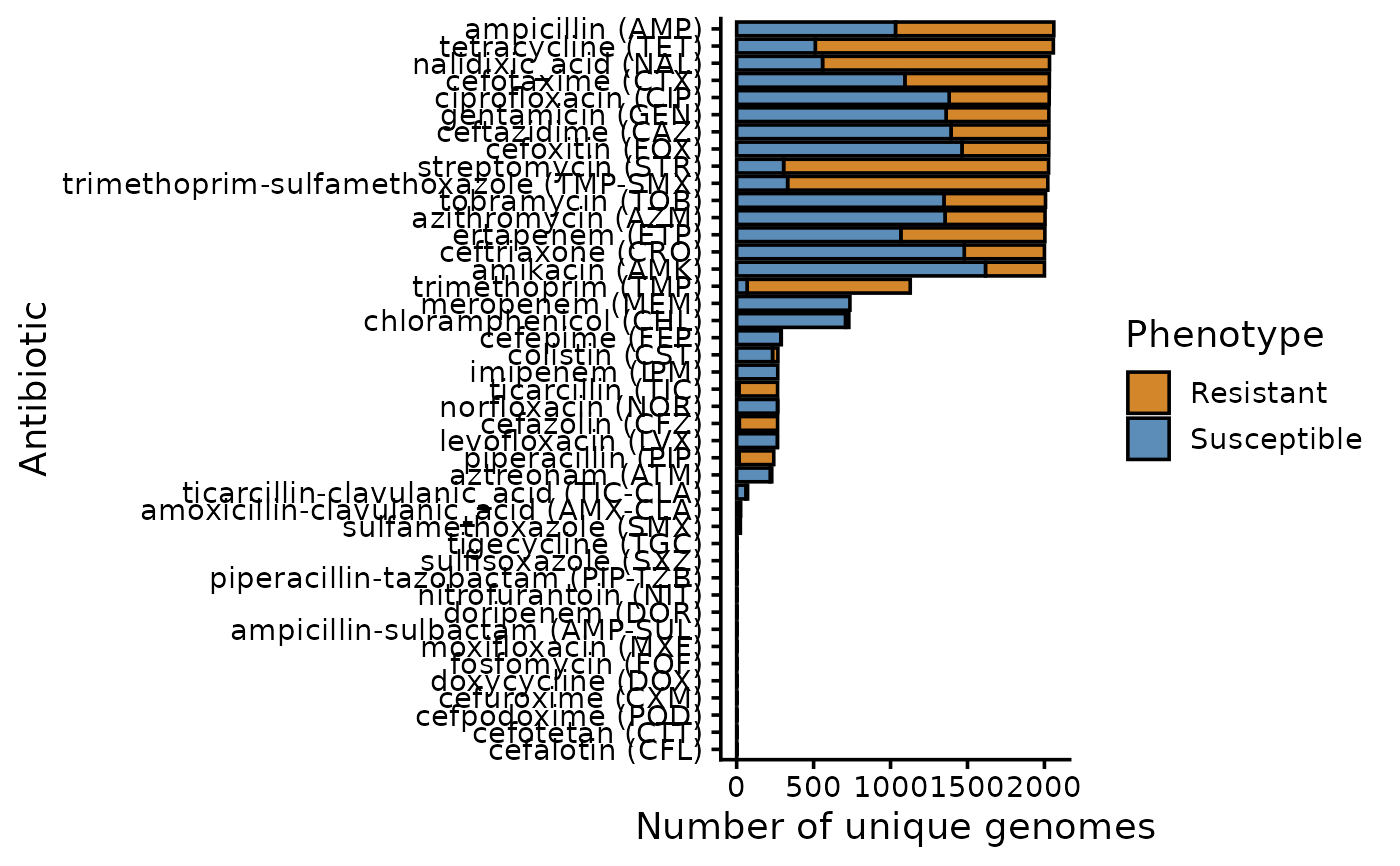
Reads metadata and generates a stacked bar plot showing counts of resistant and susceptible phenotypes per antibiotic.
plotDrugDist(metadata_path = ".")Value
A ggplot object.
Examples
plotDrugDist(metadata_path = system.file("extdata", package = "amRml"))