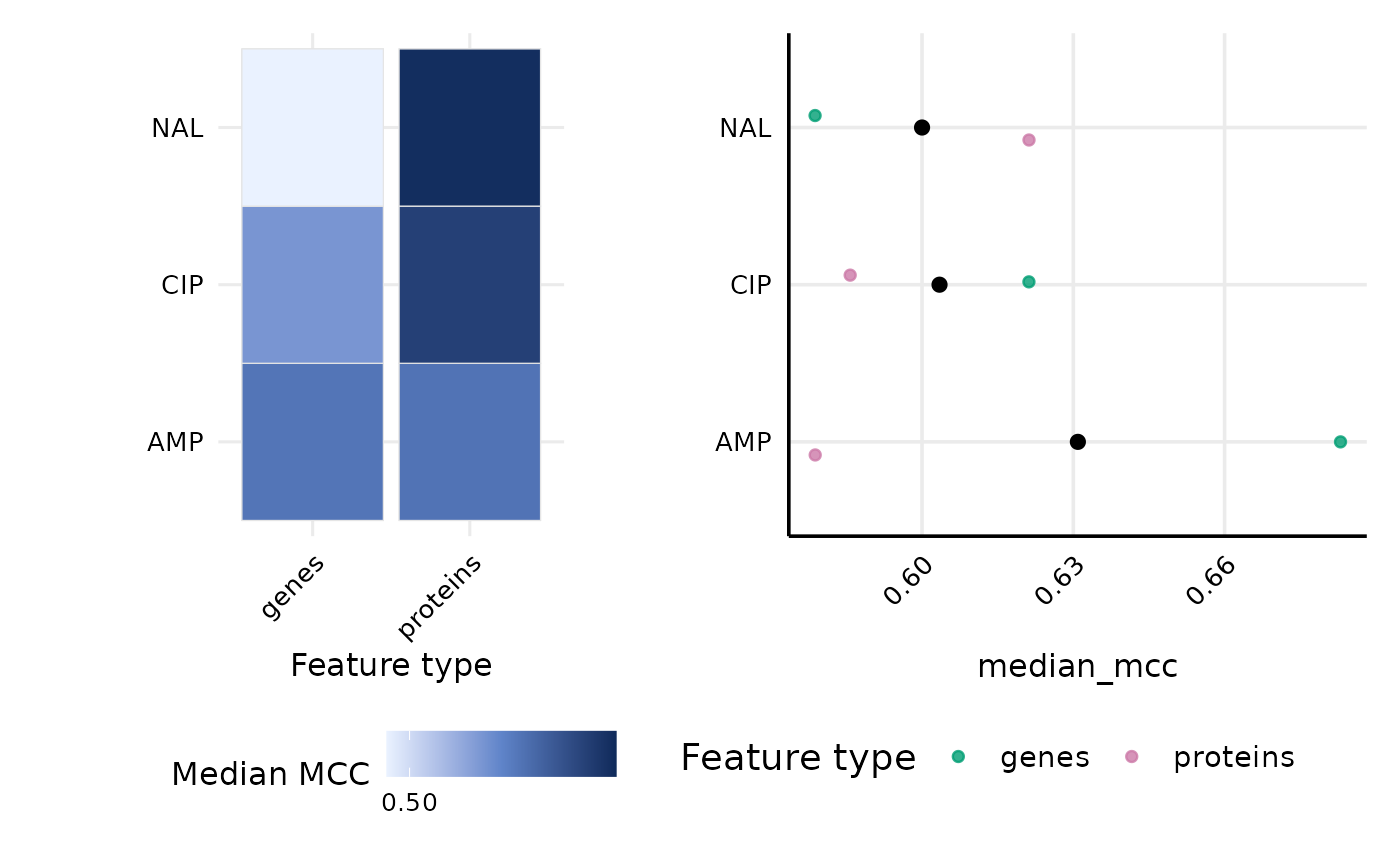
Generates heatmaps and ridge plots summarizing model performance (MCC) across drugs and feature types.
plotDrugPerf(metadata_path = ".", performance_path = ".")Arguments
Value
A patchwork ggplot object combining multiple panels.
Examples
# Several models per drug x feature type so the ridge densities can be drawn.
performance <- tidyr::expand_grid(
  drug_or_class = c("AMP", "CIP", "NAL"),
  feature_type = c("genes", "proteins"),
  feature_subtype = c("binary", "counts"),
  replicate = 1:8
)
performance$drug_label <- "drug"
performance$shuffled <- FALSE
performance$mcc <- 0.6 + 0.3 * sin(seq_len(nrow(performance)))
plotDrugPerf(
  metadata_path = system.file("extdata", package = "amRml"),
  performance_path = performance
)
#> Picking joint bandwidth of 0.0177