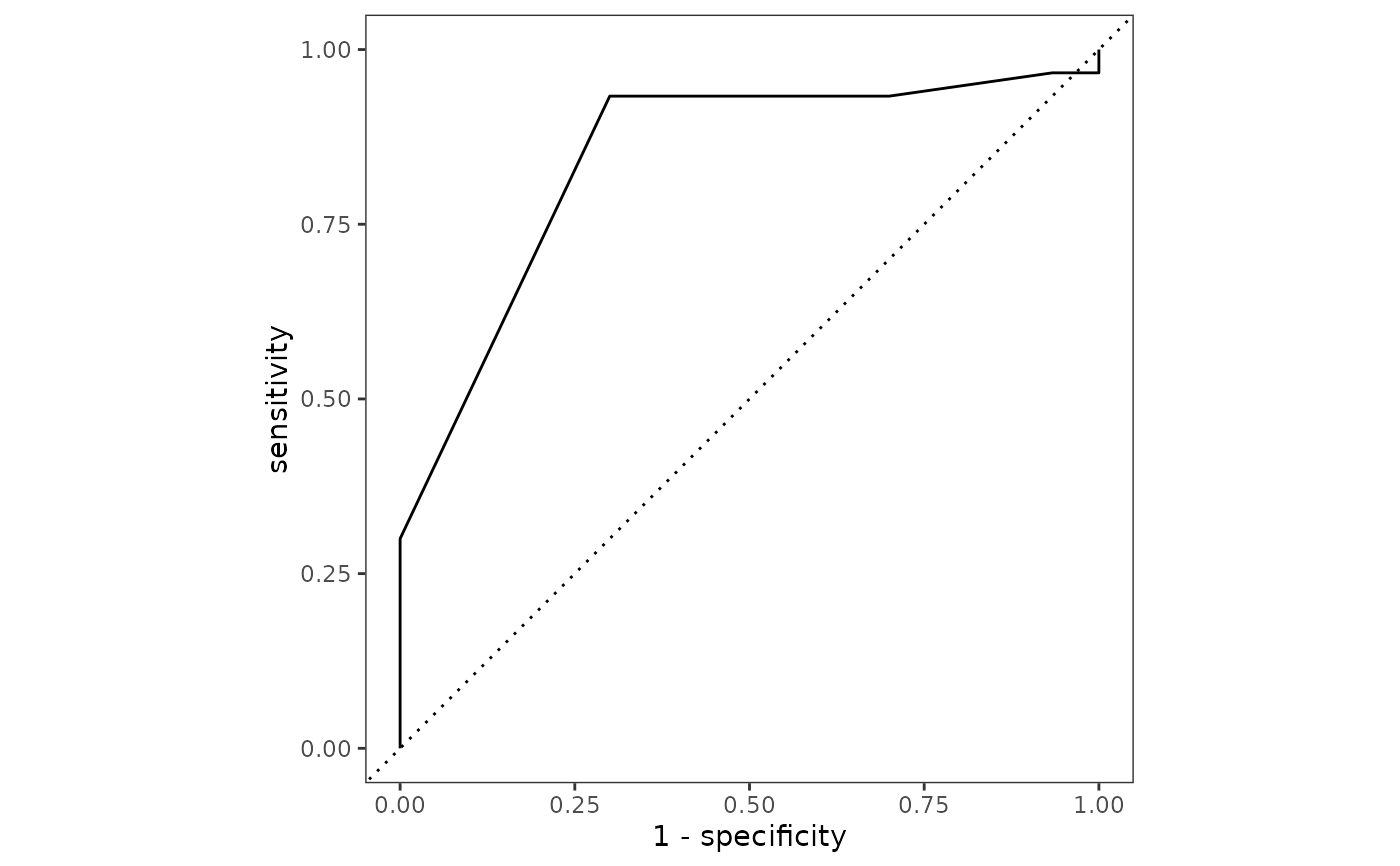
Generates a ROC curve for AMR phenotype prediction results.
plotROC(test_data_plus_predictions)Arguments
- test_data_plus_predictions
A tibble of test data with prediction columns (e.g. the output of
predictML()orrunMLmodels(return_pred=TRUE)), or a path to a TSV file containing the same.
Value
A ROC curve plotted using ggplot2::autoplot().