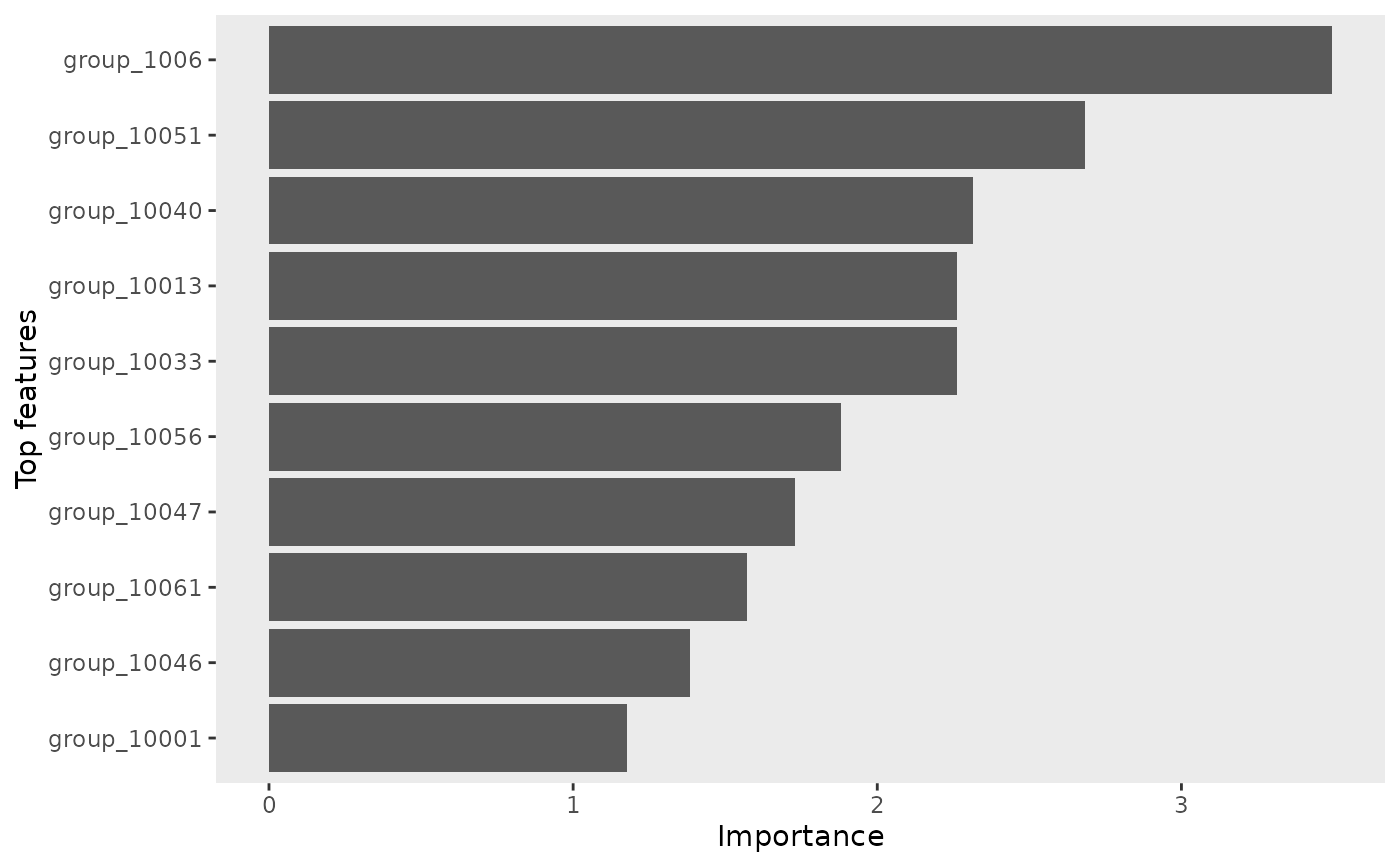
Creates a bar plot showing the most important features affecting AMR phenotype predictions.
plotTopFeatsVI(topfeat, n_top_feats = 10)Arguments
- topfeat
A tibble of feature importance scores (e.g. the output of
extractTopFeats()orrunMLmodels()), withVariable,Importance, andSigncolumns, or a path to a TSV file containing the same.- n_top_feats
Number of top features to display (default: 10).
Value
A bar plot of variable importance (ggplot2 object).
Examples
data(demo_fit)
top_feats <- extractTopFeats(demo_fit, n_top_feats = 10)
plotTopFeatsVI(top_feats, n_top_feats = 10)