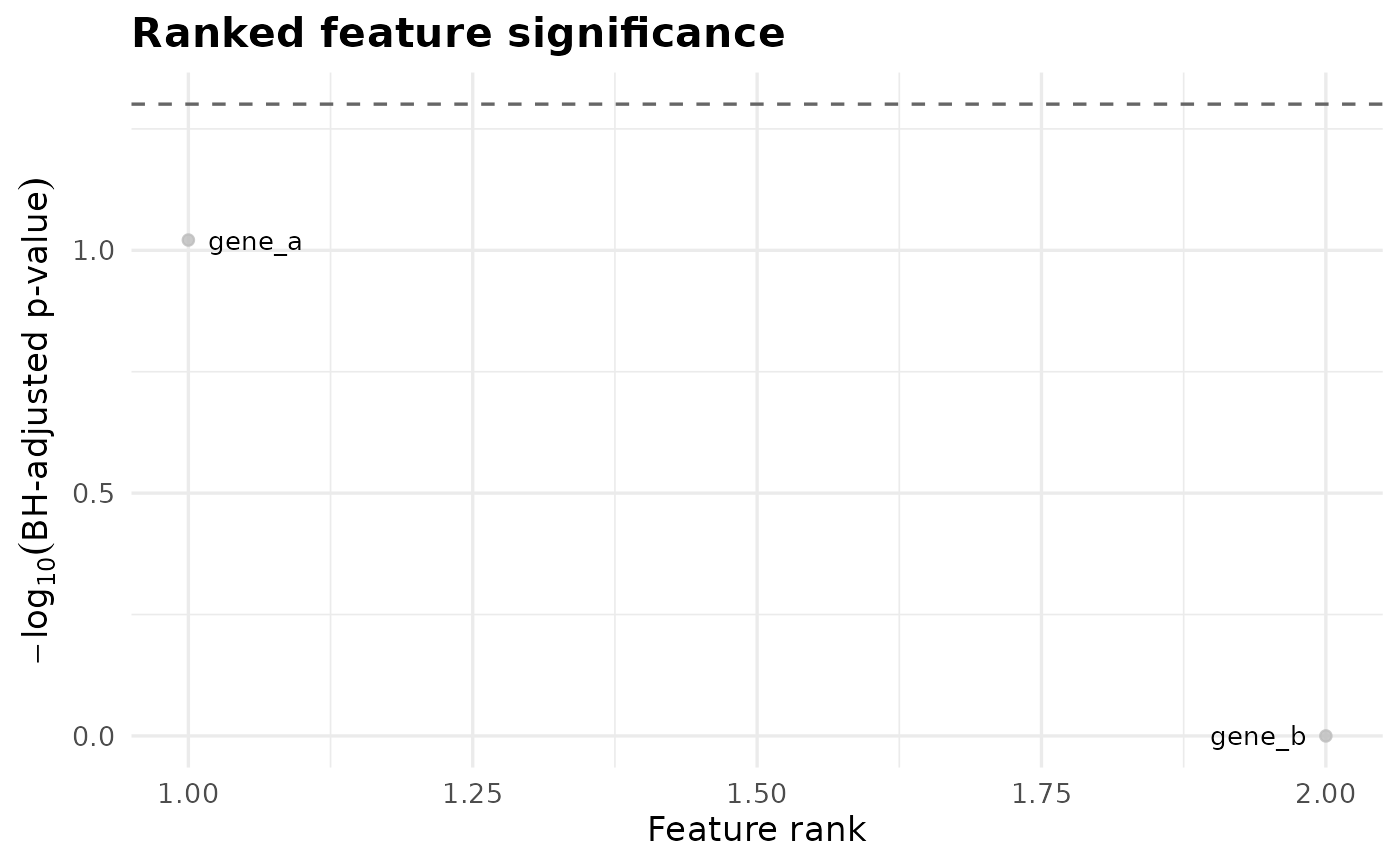
This function visualizes all features from runFishers() ranked by
BH-adjusted p-value and explicitly highlights those that pass the
significance threshold. Optionally, the top N most significant features
can be labeled.
plotFishers(fisher_df, alpha = 0.05, label_top_n = 5)Arguments
- fisher_df
A data frame returned by
runFishers()containing at minimum the columns:gene
adj_p_value
sig_after_bh
- alpha
BH-adjusted significance threshold. Default is 0.05.
- label_top_n
Number of top-ranked features to label. Default is 5. Set to 0 to disable labeling.
Value
A ggplot2 object.
Details
Each point represents a feature. Color explicitly encodes whether a feature passes the BH threshold. Labels are applied only to the top-ranked features to preserve clarity.
Examples
long <- tibble::tibble(
  genome_id = rep(paste0("g", 1:10), each = 2),
  feature_id = rep(c("gene_a", "gene_b"), 10),
  value = c(
    1, 0, 1, 0, 1, 1, 1, 1, 0, 1,
    0, 0, 0, 1, 0, 1, 0, 1, 0, 0
  ),
  genome_drug.resistant_phenotype = rep(
    rep(c("Resistant", "Susceptible"), each = 5),
    each = 2
  )
)
tmp <- tempfile(fileext = ".parquet")
arrow::write_parquet(long, tmp)
fisher_results <- runFishers(tmp, Q = 0.05)
plotFishers(fisher_results, alpha = 0.05, label_top_n = 2)